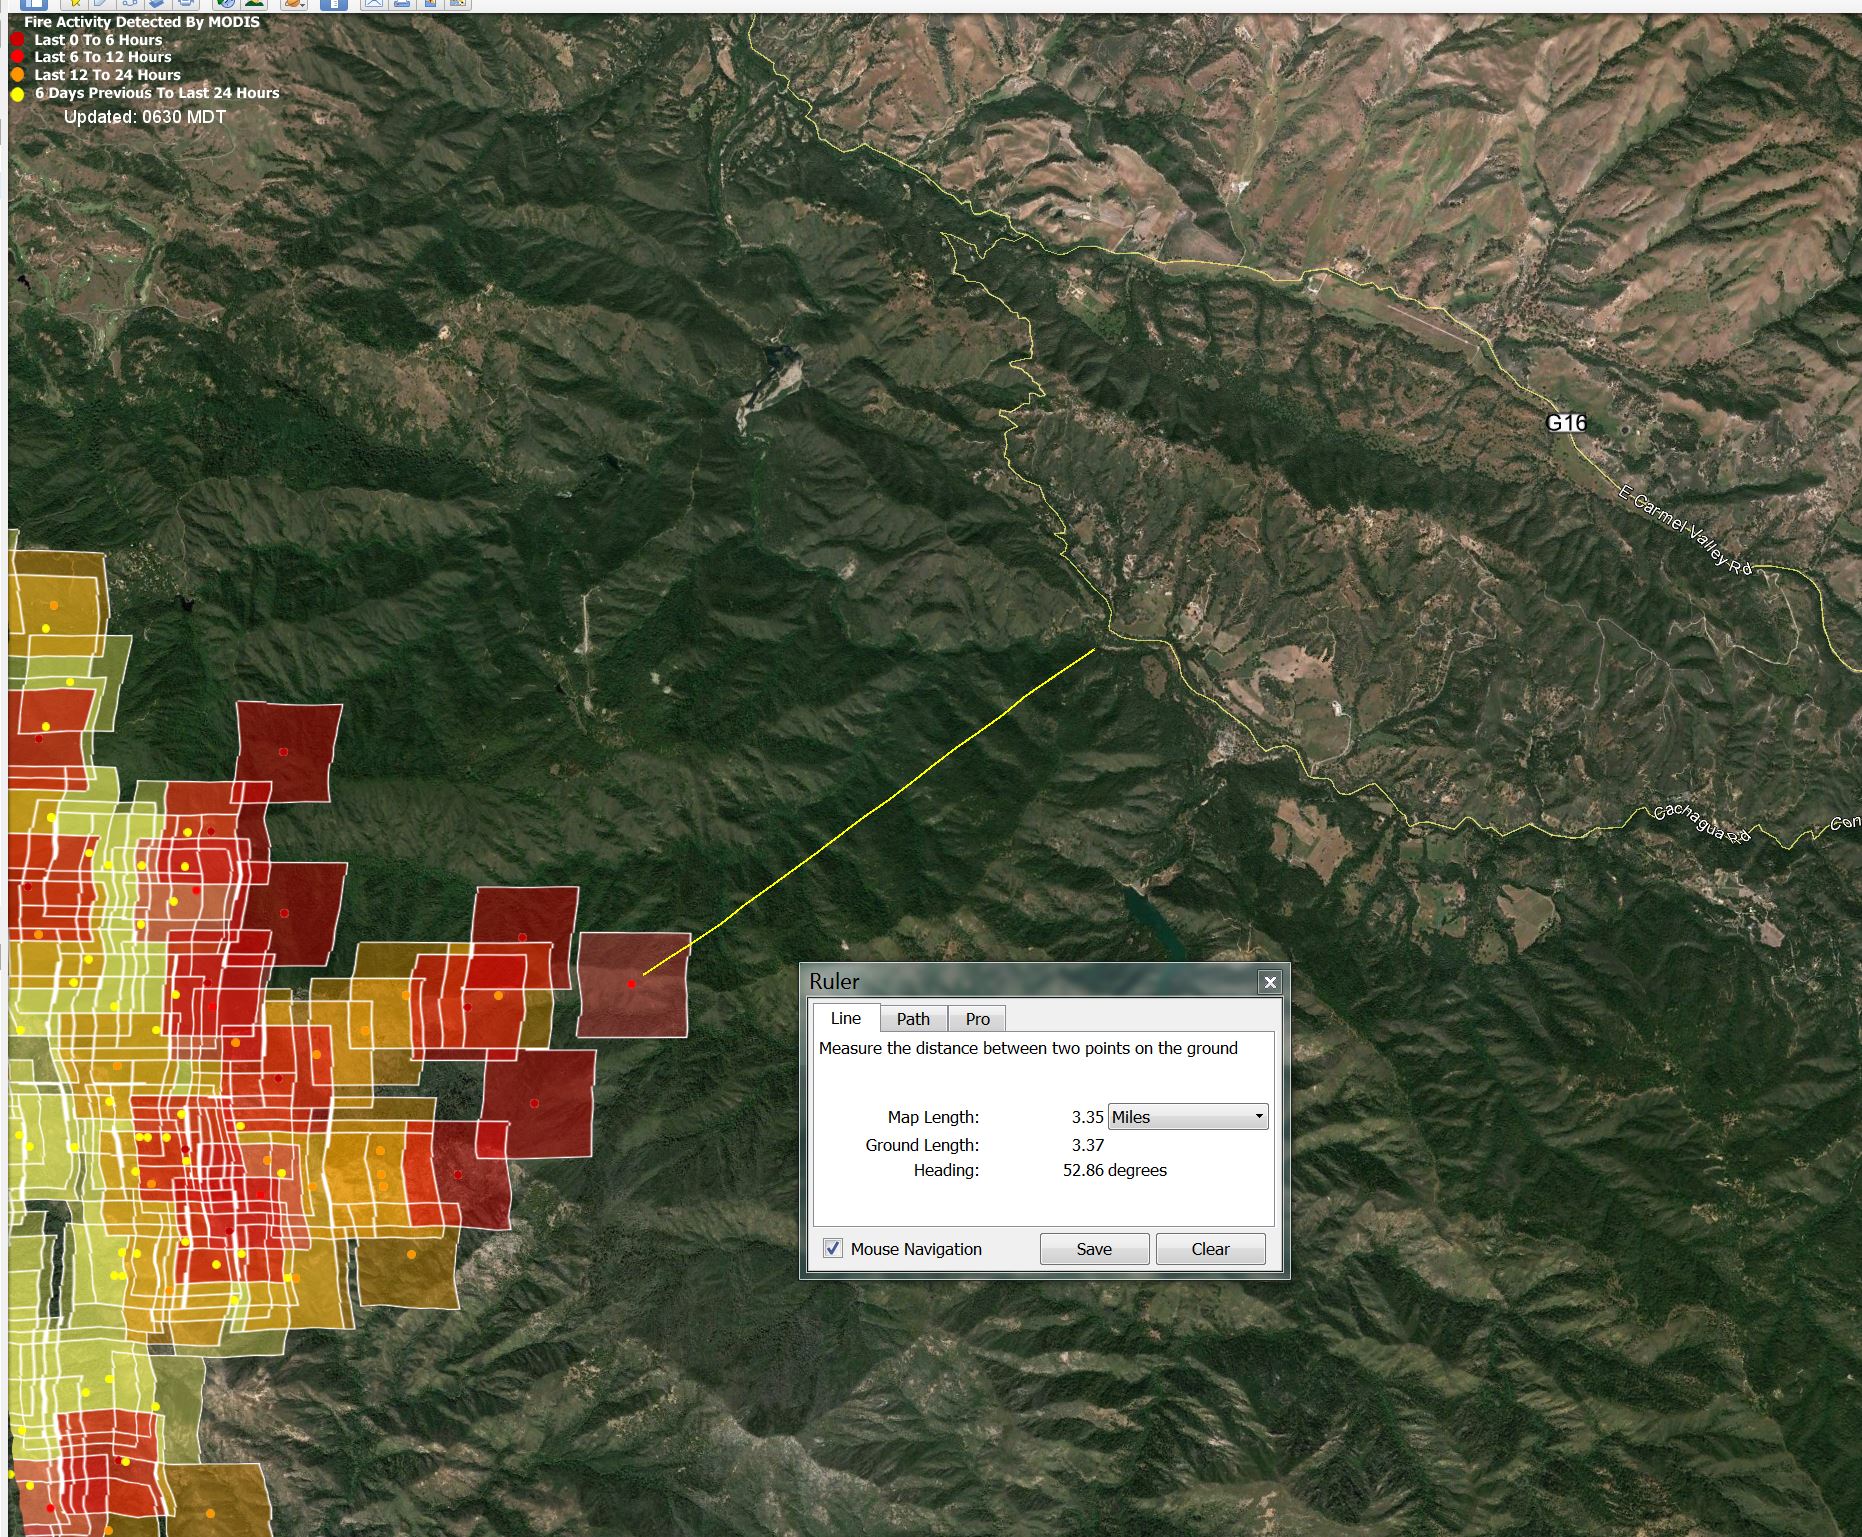
The southern part of the fire progressed eastward overnight, but there was no heat detected in the formerly threatened parts of Carmel Highlands and Rancho San Carlos. There is a hot spot near White Rock, which may be a back burn.
It is now a little over three miles from Cachagua:
Overlaying the dozer map as of midnight the night before last, you can see that it is still some distance from the completed and planned fire breaks, except for the ones to the west that it overran yesterday:
XXX’s are completed fire breaks. XOXO’s are planned ones, as of 0100 7/29. Again, thanks to Big Sur Kate for the map.
I will repeat myself here, so those of you who know everything there is to know about reading MODIS maps can move on. The size of the square represents the nominal margin of error. The fire could be anywhere in the square, not just at the center. Dark red squares were detected less than six hours before the data set was created. Light red squares were detected less than twelve hours before the data set was created. Orange squares were detected less than 24 hours before the data set was created. Yellow squares were detected less than six days before the data set was created. Since the fire is now over six days old, some of the early detections have dropped off the map. MODIS makes mistakes, sometimes missing outbreaks, and sometime misplacing them outside the nominal margin of error. It is also a snapshot of the activity at the time the satellite is overhead, and will definitely miss flare ups between passes. MODIS can’t tell the difference between wildfires and intentional back burns.
Cal Fire stats as of 0700: 33,668 acres, still 15% contained.


Leave a Reply